
dLocal Updated Valuation Model

About six weeks ago, I published a deep dive on dLocal which included a valuation model.

Since then, dLocal released a stunning earnings report that beat on all metrics, showing lesser than expected declines in its take-rates and increased guidance on all key metrics.

The stock is up over 30% since my deep dive, which has led to many investors asking me whether I believe there is still upside. Today, I will run through the updated numbers and give my take on what I believe the intrinsic value of the business is.
There are several ways to value a business but in the context of dLocal, I believe the most meaningful approach would be to focus on its core drivers, TPV and take-rates.
When valuing a high-growth, cross-border payments company like dLocal, looking only one or two years forward is often misleading. The business is still in an expansion phase, with significant operating leverage ahead, so near-term earnings don’t capture its long-term earnings power.
Hence I’ve decided to model out to FY 2030, giving the business 5 years to:
Capture compounding effects of TPV growth
TPV is the primary driver of revenue. dLocal is expanding into new geographies and onboarding new enterprise clients, both of which compound over time. A longer time horizon allows me to reflect the impact of this compounding more realistically.
Smoothens out short-term volatility
dLocal’s take-rates are in flux, with a general downtrend accompanied with much volatility. Extending the forecast period reduces the distortion from one-off events and shows the underlying trajectory.
Operating margin expansion potential
dLocal is still investing heavily in sales, compliance, and tech infrastructure. Over a 5–7 year horizon, operating leverage should allow for meaningful margin expansion. Modelling out to 2030 helps visualise how margins might normalise.
Anchor valuation on long-term earnings power
A DCF or terminal multiple is only as useful as the quality of assumptions leading into it. Extending the model to 2030 creates a bridge to a more mature version of dLocal’s business, which I believe will provide a stronger anchor for the terminal value and reduce reliance on aggressive assumptions.
Table of Contents
Current Snapshot
Key Assumptions
Projections
What I’m Personally Doing
1. Current Snapshot
Before jumping in, let me set the stage with a few anchors from the last 6 quarters, along with updated FY 2025 guidance from management.
FY 2024:
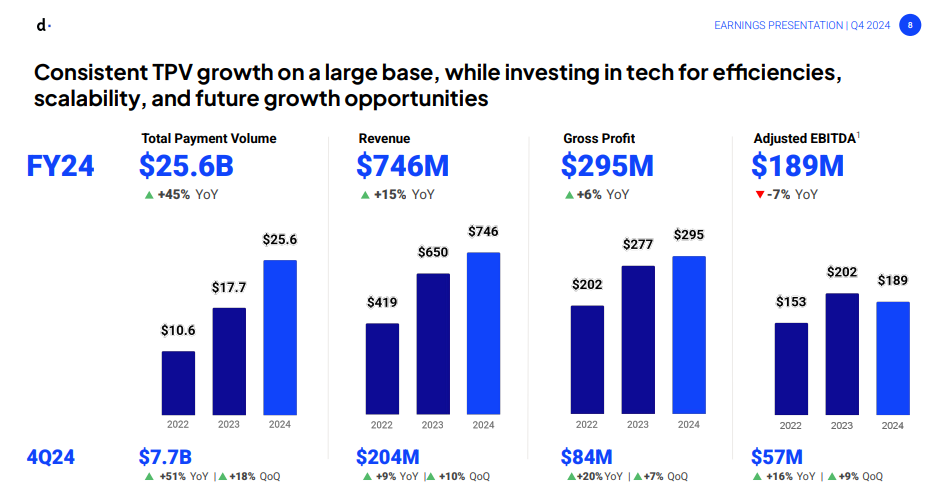
TPV: $25.6B (+45%)
Revenue: $746M (+15%)
Gross Profit: $295M (+6%)
Adjusted EBITDA: $189M (-7%)
Q2 2025:
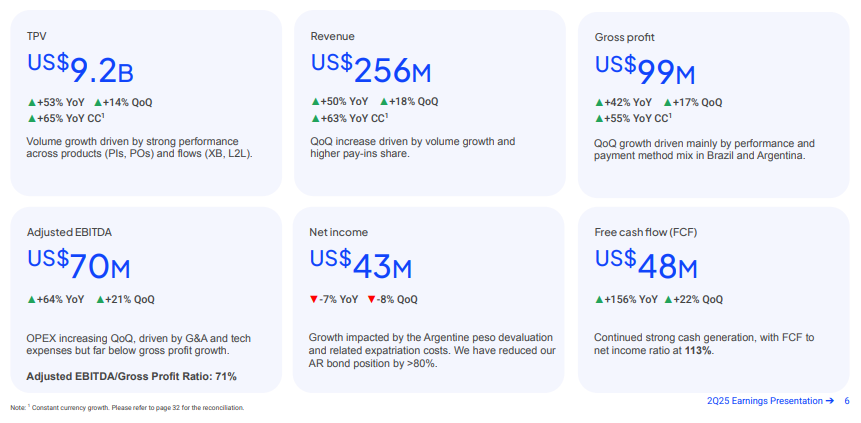
TPV: $9.2B (+53%)
Revenue: $256M (+50%)
Gross Profit: $99M (+42%)
Adjusted EBITDA: $70M (+64%)
FY 2025 Guidance (Previous/New):
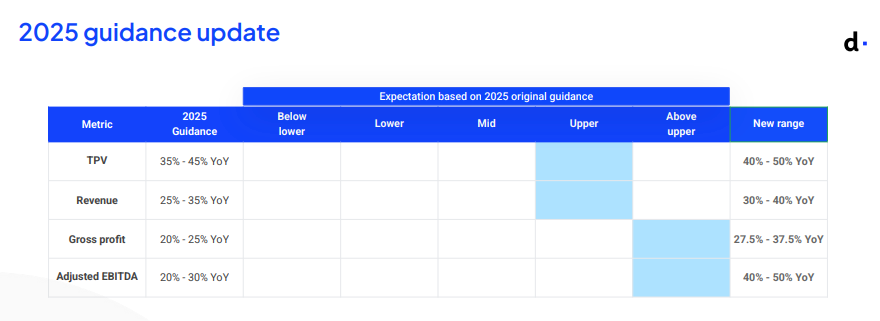
TPV: 35%-45% → 40%-50%
Revenue: 25%-35% → 30%-40%
Gross Profit: 20%-25% → 27.5%-37.5%
Adjusted EBITDA: 20%-30% → 40%-50%
Key Takeaways:
From these results, it is quite clear to see that the business has clearly re-accelerated on all key metrics. Also, it is now obvious that management had sandbagged 2025 guidance, with the latest quarter’s raised guidance on all metrics confirming that.
My personal belief is that these numbers continue to be sandbagged and we should expect a beat on the guided numbers for FY2025.
Q1 2025 and Q2 2025 saw a 53% increase in TPV. This also marked the 5th consecutive quarter of TPV re-acceleration and I do not expect this trend to end in the next few quarters.
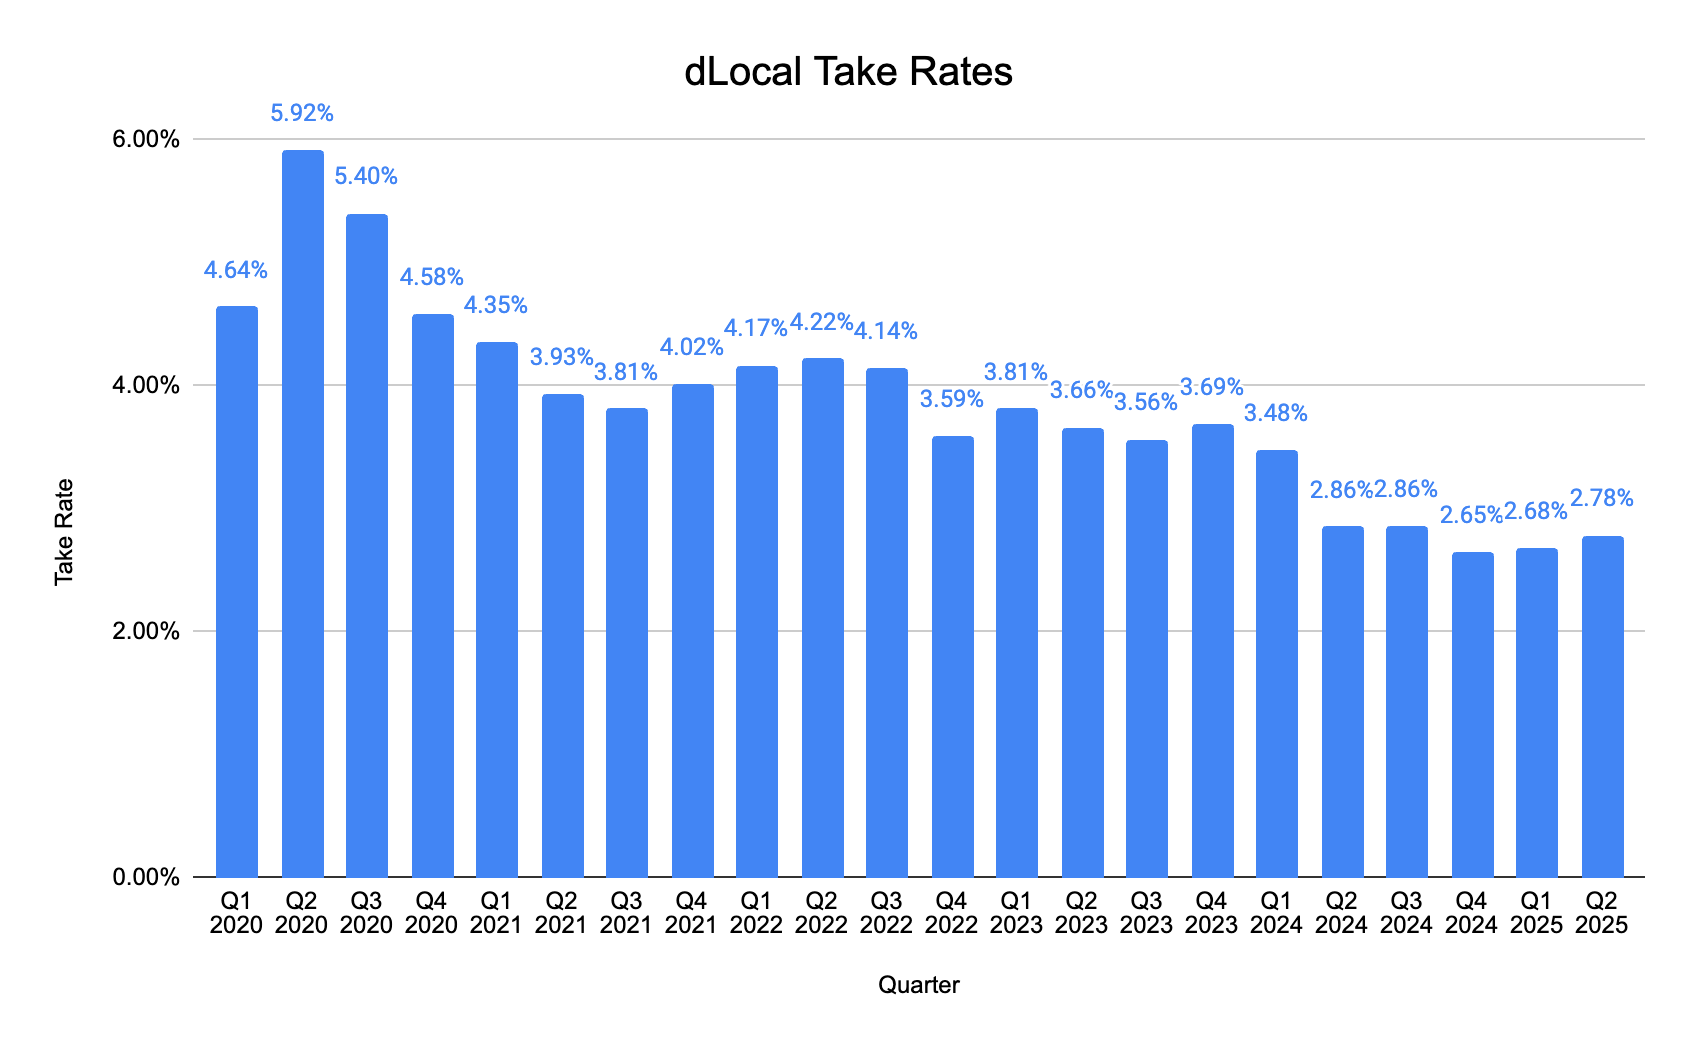
dLocal’s take-rates have grown over the past 2 quarters, from 2.65% to 2.78%. This should lead to a less-than-expected slowdown in revenue growth.
As dLocal’s new product innovations start to produce operating leverage, we could see a rapid acceleration in the adjusted EBITDA numbers this quarter.
Financials since 2020:
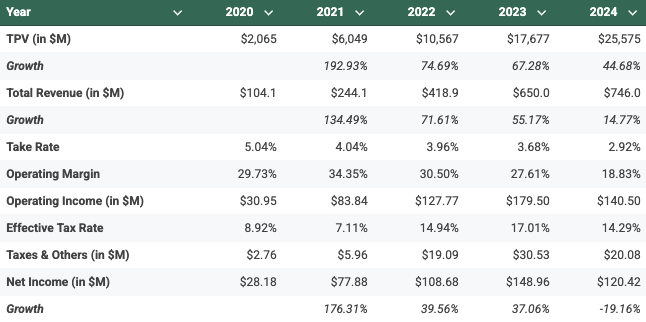
TPV growth has slowed massively from nearly a 3x gain in 2021 to just under 50% gain in 2024.
More concerningly, take-rates have fallen expeditiously from ~5% in 2020 to below 3% in 2024.
This has caused a massive hit in operating margins and led to lesser than expected earnings growth despite the massive compounding of TPV.
From 2020 to 2025, TPV ~12x-ed while net income only grew by ~4x.
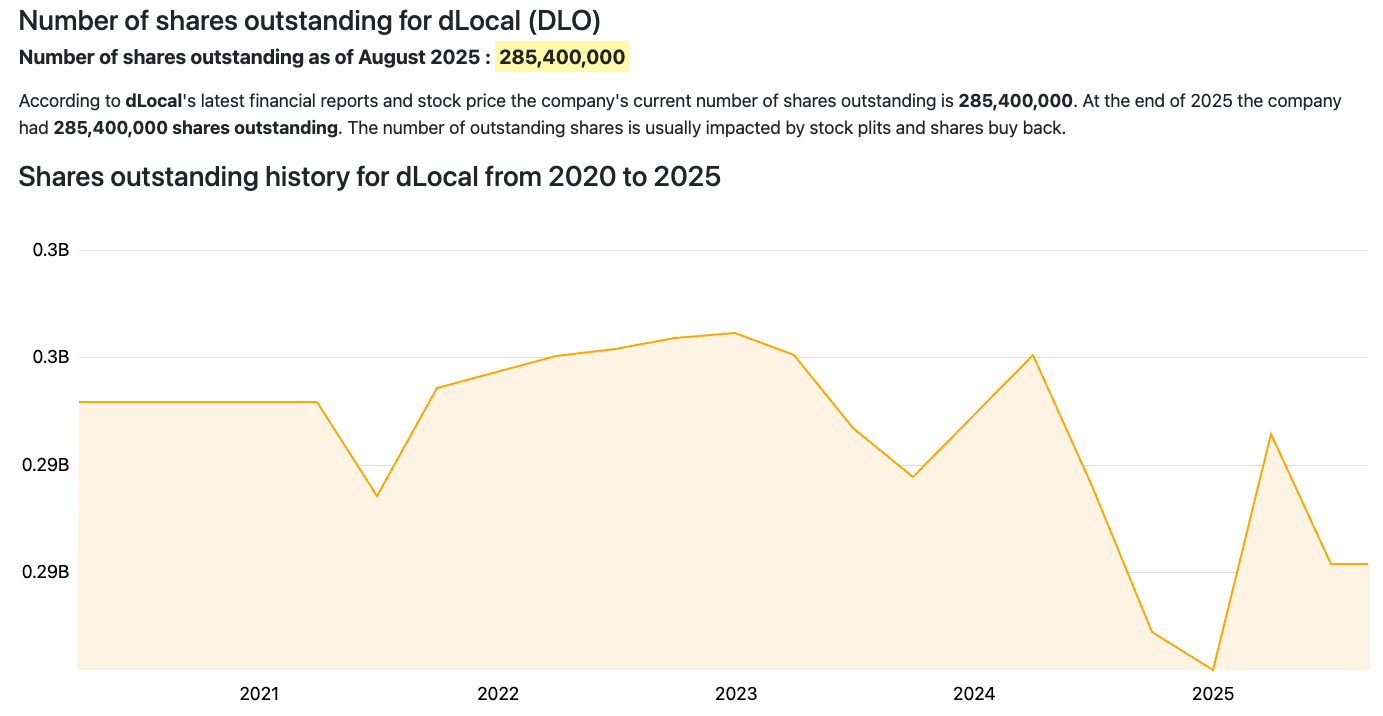
Encouragingly, despite dLocal being a growth company, shares outstanding have fallen over the past 5 years, along with a one-time large cash dividend in May 2025 of ~5% ($0.51 per share).
2. Key Assumptions
In-line with management’s numbers, I will attempt to project a base case for the stock into FY2030.
TPV: 45%, laddered down to 32.5% in FY2030 in 2.5% decrements
Management has guided for 40-50% TPV growth for FY2025. I believe this is a very conservative case as TPV growth has re-accelerated over the past 6 quarters.
In addition, as I discussed in my dLocal deep dive, we are likely to see elevated growth in regions like LatAm for the following reason articulated by dLocal CEO Pedro Arnt:
“Because you don’t have the kind of absolutely widespread digital adoption that you already have in the developed world, you almost have a benefit when you’re growing and scaling out your companies. I remember investors would always bitch at us and be like: “Why aren’t you growing 300% year on year, you’re only growing at 40%”. And the answer was always, the market isn’t growing that fast.
But on the other hand, we’re not going to run out of expanding addressable market to paper over our mistakes in three years. We have a 20 or 15 year run rate, so it generates an environment that I believe allows for a more methodic and almost easier scale up of a company because you’re not having to face 400% year on year growth. So you’re consistently doing 40% over long periods of time.”
I believe we are likely to see a top-line beat this year, but for the purposes of conservatism, I will stick to a 45% TPV growth rate for FY2025.
Take-Rate: 2.70%, laddered down to 2.40% in FY2030 in 0.05% decrements (0.1% decrement from 2025→2026 to account for near-term pressure)
Management has not given an explicit take-rate guidance but a 2.70% take-rate would equate to 34% revenue growth which is in-line with guidance of 30-40%.
Take-Rates have come down substantially in recent years, and management expects a continued downtrend. However, management did say in Q2 2025:
“Erosion in take rate is gradual, that as we offer more frontier markets and mix shift moves away from some of the larger markets. And more importantly, as we accelerate our go-to-market of new products and new value-added services such as Buy Now Pay Later, those are also potentially higher take rate products. And so that all in, although we still think take rates will continue to decline, we probably have a more constructive view in both the pace of that decline and also what the bottom may be.”
Operating Margin: 20%, laddered up to 25% in FY2030 in 1% increments
From 2020 to 2023, dLocal’s operating margin fluctuated between 27% to 34%. Last year, operating margin fell substantially to 18% due to short-term issues as highlighted by the company.
2023-2024 saw a heavy build-out with new licenses, banking partners and local entities. These are typically step-function costs that don’t scale with volume and are front-loaded. Once live, they amortise over a much larger base, proving operating leverage for the businesses.
1% increments annually are extremely conservative as even modest OPEX discipline would likely yield >100bps in operating margin lift. 25% would still be far under dLocal’s historical operating margins. Also important to note here is management’s guidance for gross profit increasing by ~50% and Adjusted EBITDA doubling at the bottom-end of the range and growing by ~66% at the top of the range.
Effective Tax Rate: 18% fixed
Between 2020 to 2024, dLocal’s effective tax rate has ranged from 7% to 17%. I believe 18% is an extremely conservative rate that bakes in expansion into higher-tax jurisdictions.
Share Count: 1% Annual Dilution to 300M in FY2030
As discussed above, dLocal’s shares outstanding has declined over the past 5 years despite the business experiencing rapid growth in revenues and hiring.
The beauty of dLocal’s business is such that it doesn’t require massive capital investments to grow. Hence why management decided to approve a 5% dividend earlier this year. Management has also pledged to give 30% of future annual free cash flows as dividends from 2026 onward.
I believe this is a very conservative case and there could be arguments made that the share count may actually reduce over the next 5 years.
Summary
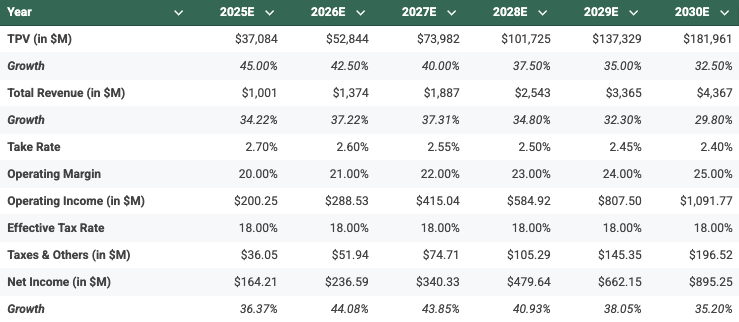
This is a summary of the assumptions I’ve run through above.
Net income is entirely a function of the assumptions I’ve made. Net margins are expected to rise from 16.4% in 2025 to 20.5% in 2030, which is consistent with scaled, asset-light PSPs that monetise value-add services and keep OPEX growth below revenue growth.
3. Projections
Based on the assumptions above, dLocal’s 2030 net income comes out to about $895M.
The next step will be to estimate a PE multiple for the business in 2030. Today, dLocal trades at ~30x PE with earnings expected to grow at ~36%.
In the assumptions made above, earnings growth for the business in 2030 is expected to be ~35% which is roughly in line with today. Hence, an argument could be made that the PE in 2030 will be ~30x too.
However, to be extra conservative and to account for a degradation in margins, poor investor sentiment and potential market pessimism during that period, I will assume a base case 20x PE multiple, with 15x for bear and 25x for bull.
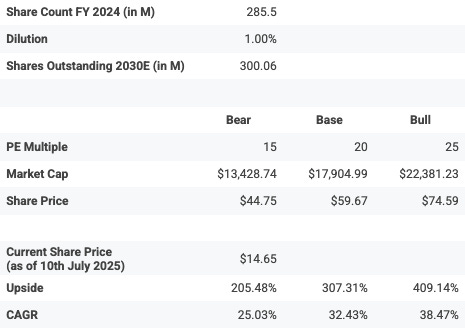
On the base case that implies a $17.9B market cap in 2030, or $59.67 per share. Versus today’s $14.65, that is ~307% upside, roughly a 32.4% CAGR.
The bear case implies a 25% CAGR which is extremely strong.
Using a 12% discount rate, the present value of dLocal’s 2030 valuation is about $33.85. That represents ~131% upside from today’s price.
4. What I’m Personally Doing
This final section is for paid subscribers, where I will be sharing my personal moves in my portfolio related to dLocal.
If you’re considering upgrading your subscription, there is currently a 20% discount. As a reminder, subscribers get access to (but not limited to):
Full Deep Dive Articles (Min. 1 per month)
Access to Portfolio Performance & Holdings (1 a month)
Full Archive of Articles (60 and counting)
Unlimited DMs + Chat Functionality
For free subscribers, rest assured that I am committed to providing majority of the content for free, with the additional content for investors who are looking for more in-depth analysis and my personal thoughts on how things may pan out.