
Sea Limited Comprehensive Financials Dashboard

Hi all,
As many of you know, I’ve been covering Sea Limited for a long time and have built up a fairly deep understanding of the business over the years.
Along the way, I’ve maintained various documents tracking different parts of the company: Shopee, Garena, Monee, financials, market share data, segment KPIs, and broader industry developments.
Over the past month, I decided to consolidate all of that into one comprehensive spreadsheet, or more specifically, a Google Sheets dashboard.
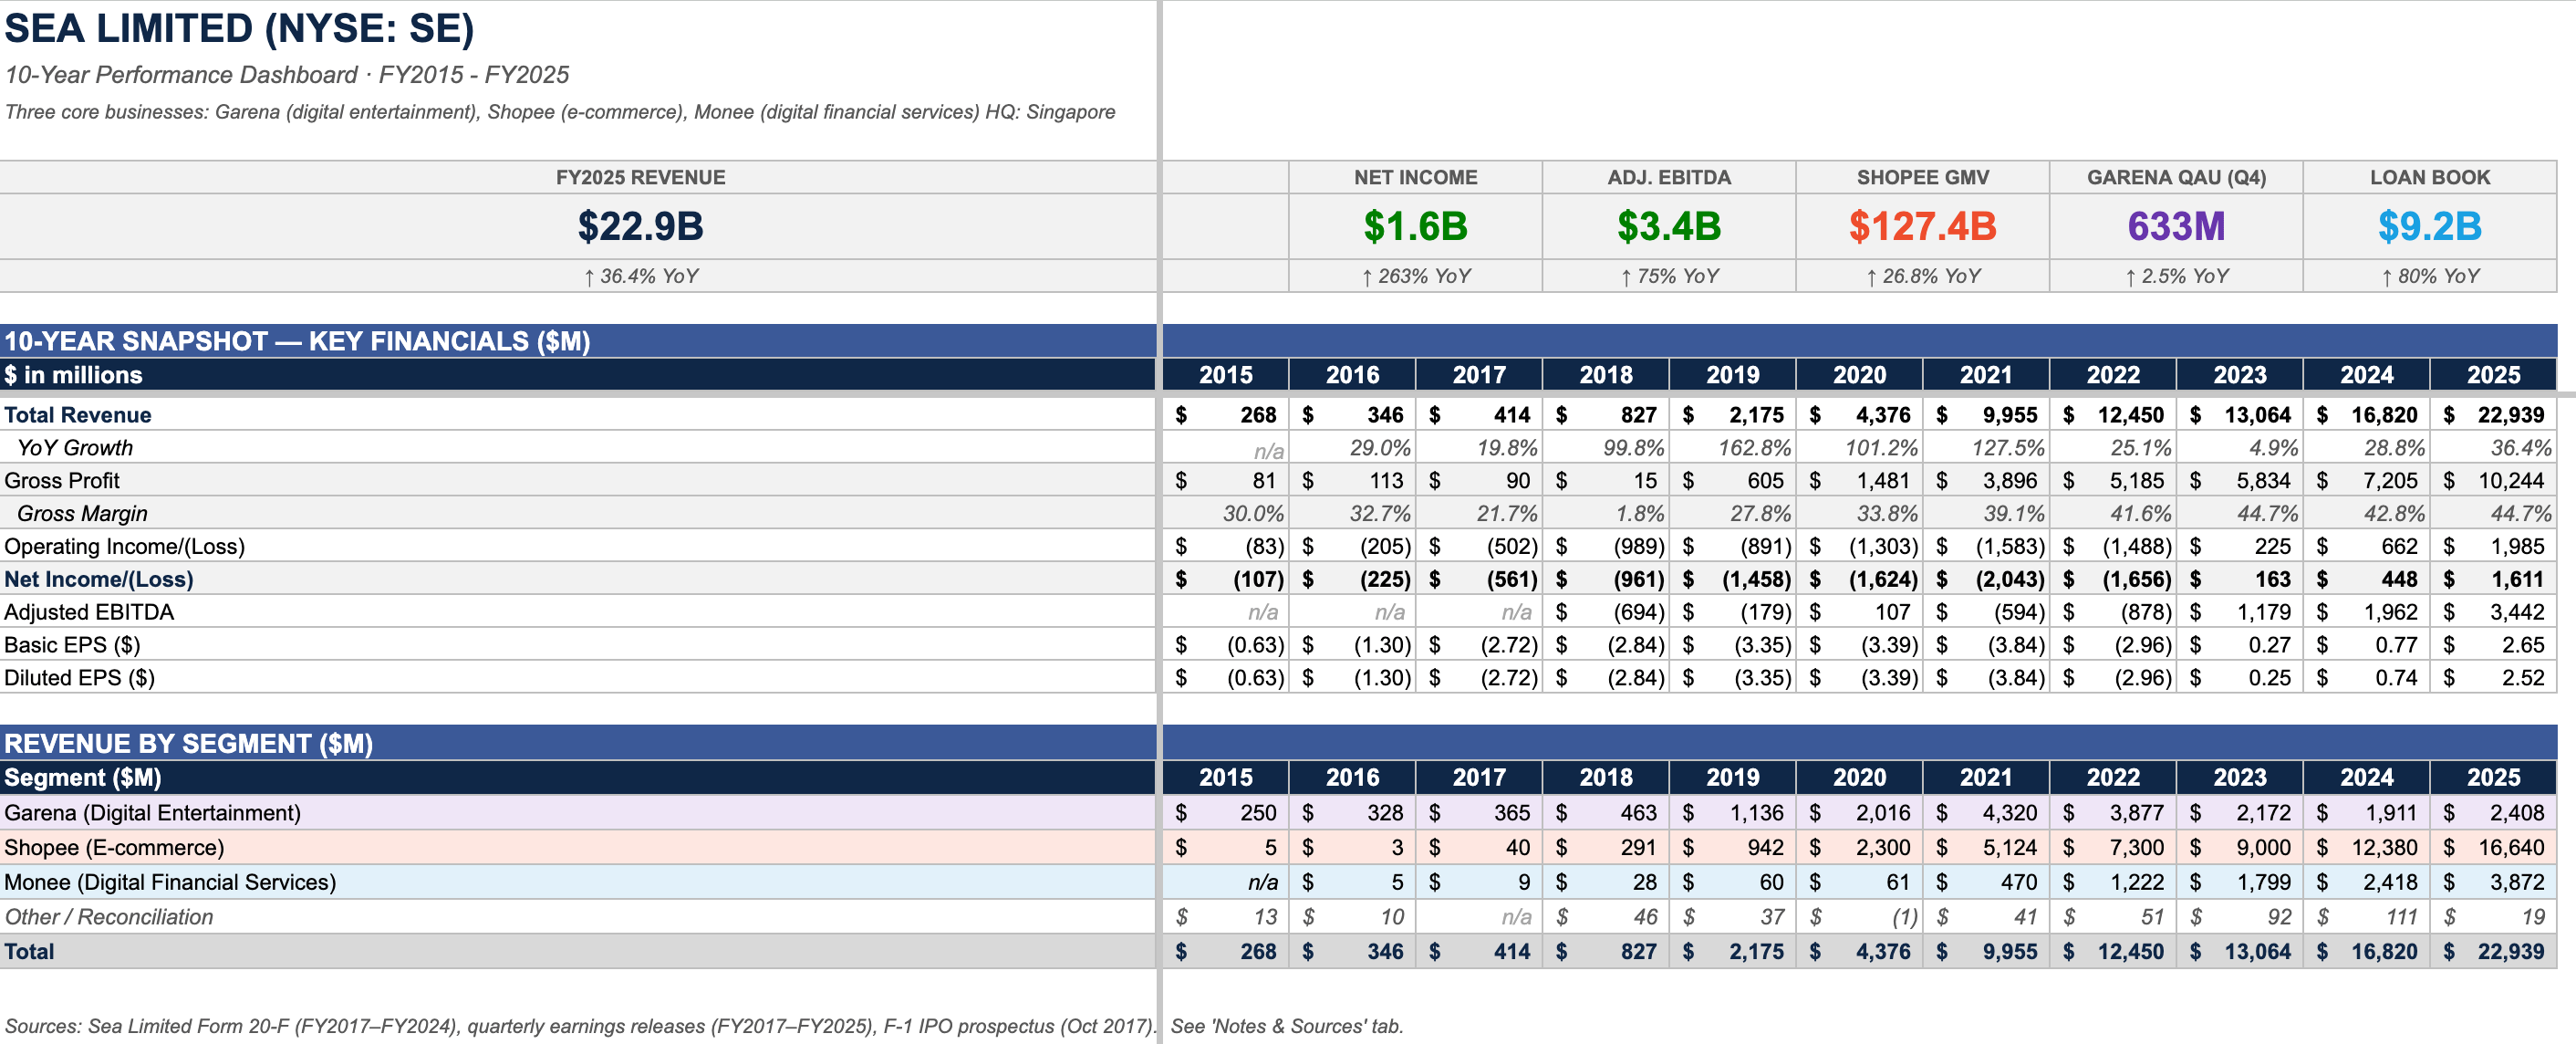

This dashboard contains 15 separate tabs, covering everything from the income statement and balance sheet to more granular operating data across Shopee, Garena, and Monee. It also includes what I personally find to be some of the most useful data points for understanding Sea: e-commerce market share, food delivery market share, and other segment-level KPIs that help track the real progress of the business.
The dataset goes all the way back to 2015, two years before Sea went public, and includes both quarterly and annual data where available. I’ve also tried to include information that is not typically found on financial aggregator websites, but is instead buried in 20-F filings, earnings calls, investor presentations, and other company disclosures.
The goal of this dashboard is to create a single place where investors can track Sea’s business evolution properly, moving beyond just the headline numbers and looking at the actual drivers of the business.
Sea is not an easy company to analyse from surface-level numbers alone. The group has multiple moving pieces across e-commerce, gaming, digital financial services, logistics, advertising, credit, and food delivery.
For example, Shopee’s reported revenue only tells part of the story. To really understand the business, we need to track GMV, take rate, order growth, monetisation, logistics strategy, advertising revenue, competitive intensity, and market share across Southeast Asia, Brazil, and other markets.
Monee is also becoming increasingly important. As the credit business scales, investors need to pay attention not only to revenue and EBITDA growth, but also loan book size, non-performing loans, user penetration, and how Sea is balancing growth with credit risk.
This will also be a working document. I plan to update it every quarter as Sea reports earnings and as more data becomes available. Over time, I expect the dashboard to become more useful as the historical dataset deepens and more segment-level trends become visible.
I’m also open to feedback. If there are additional metrics, charts, or datasets that would make the dashboard more useful, I’m happy to consider adding them.
For now, I hope this serves as a helpful resource for anyone trying to understand Sea Limited at a deeper level.