
dLocal Q3 2025 Earnings Review
Triple Beat, 6th Straight Q of Acceleration, Concerns about Net Take Rates

dLocal reported Q3 2025 earnings after the market close on 12th November 2025.
 2025-11-12 | Seeking Alpha")
Revenue: $282.5M v $262M est. (+52% YoY, +63% FX-Neutral) 🟢
Adj. EBITDA: $71.7M v $69.1M est. (+37% YoY, +2% QoQ) 🟢
GAAP EPS: $0.18 v $0.16 est. (+93% YoY, +21% QoQ) 🟢
Selected Key Metrics
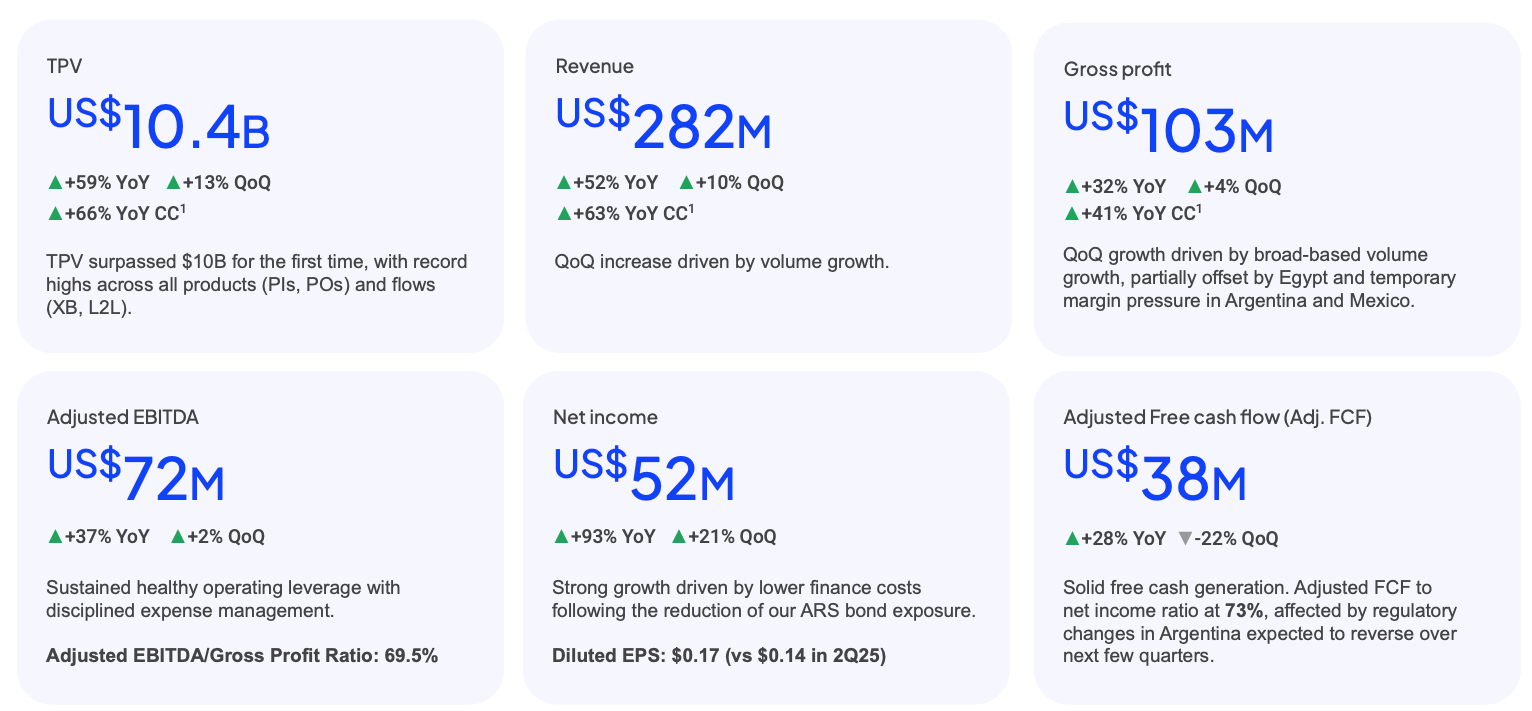
YoY growth on ALL 6 key metrics, with slight weakness on Adj. FCF due to one-time regulatory changes in Argentina that are expected to reverse over the next few quarters.
TPV: $10.4B (+59% YoY) ✅
Revenue: $256M (+52% YoY) ✅
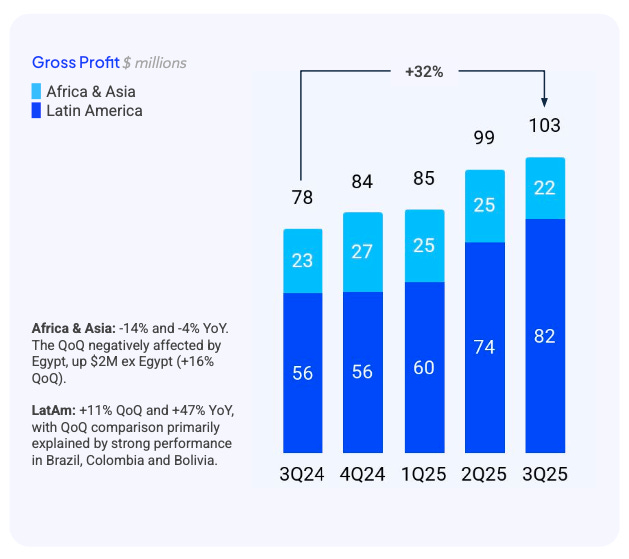
Gross Profit: $99M (+32% YoY) ✅
Adj. EBITDA: $70M (+37% YoY) ✅
Net Income: $72M (+93% YoY) ✅
Adj. FCF: $38M (+28% YoY) ✅
Table of Contents
Introduction
Financials
Guidance
Product Development
Management Commentary
Concluding Thoughts
1. Introduction
dLocal is a Latin American-based company that facilitates payment flows for businesses ranging from small startups to large conglomerates on a B2B basis, specifically targeting underserved emerging markets.
It thrives in complex payment environments, which are currently a huge tailwind for the business. Effectively, dLocal is a capital-light “toll bridge” business.
dLocal was first pitched to subscribers in July at $10.98 and has been a strong performer, with two exceptional earnings reports since (this included).

2. Financials
As I discussed in the thesis, there are TWO key metrics to track for dLocal.
The first is total payment volume (TPV). This tracks the total monetary value of all transactions processed through a company’s platform.
The second is take rates. This determines the amount of revenue generated from TPV, which ultimately affects profitability of the business.
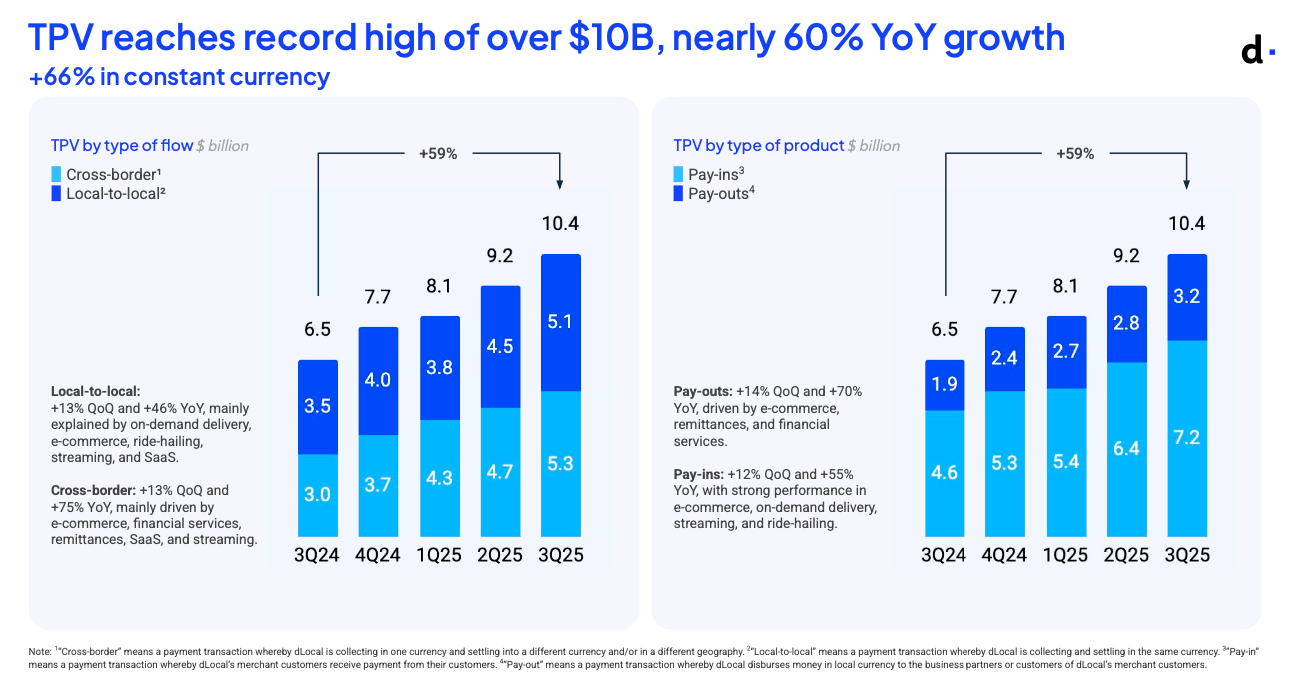
Total Payment Volume
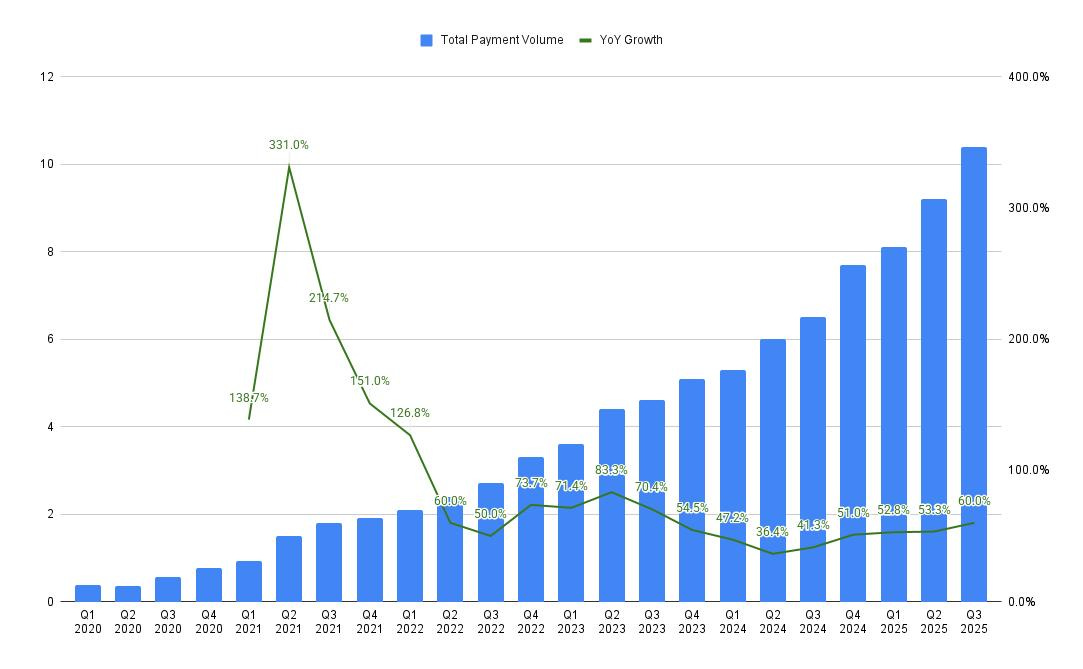
TPV was up 59% YoY and 13% QoQ.
This marked the 5th successive quarter of acceleration in TPV, no mean feat for a payments business of dLocal’s size.
Gross Take Rates (Revenue/TPV)
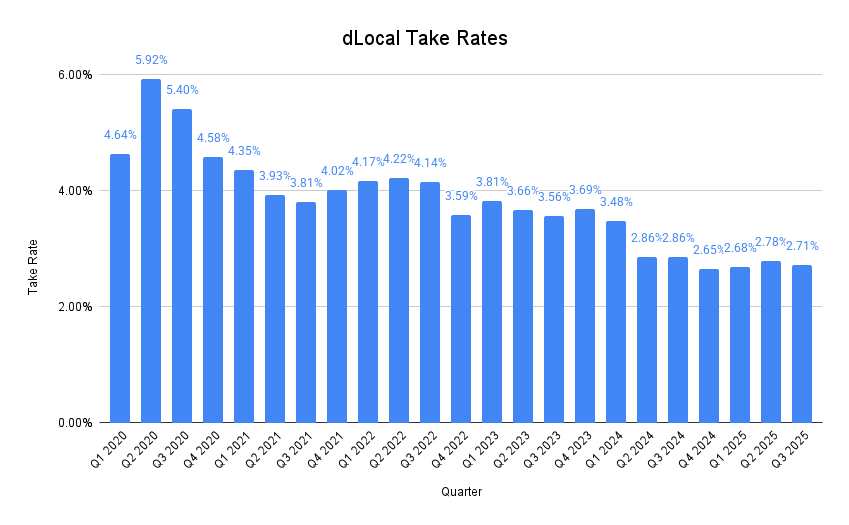
Gross take rates for the quarter were 2.71%, a 7bp decrease QoQ and 15bp decrease YoY.
However, this is not unexpected.
Payments businesses see lower take rates over time as TPV scales due to several factors including custom pricing negotiations, increased competition, shift in payment mix, and operational efficiencies that allow them to maintain profitability even with a smaller margin per transaction.
Coming into these earnings, my base case was for a continued decline in take rates, as per management’s guidance.
I am expecting take rates of 2.70% for 2025. In the first 9 months of 2025, take rates are now averaging 2.72%, above my expected rate.
In the previous quarter, CEO Pedro Arnt mentioned that the erosion in take rate is gradual and that as it expands into frontier markets and accelerates its go-to-market on new products and value-added services, it could lead to a slower pace of decline and a more constructive view of what the bottom may be.
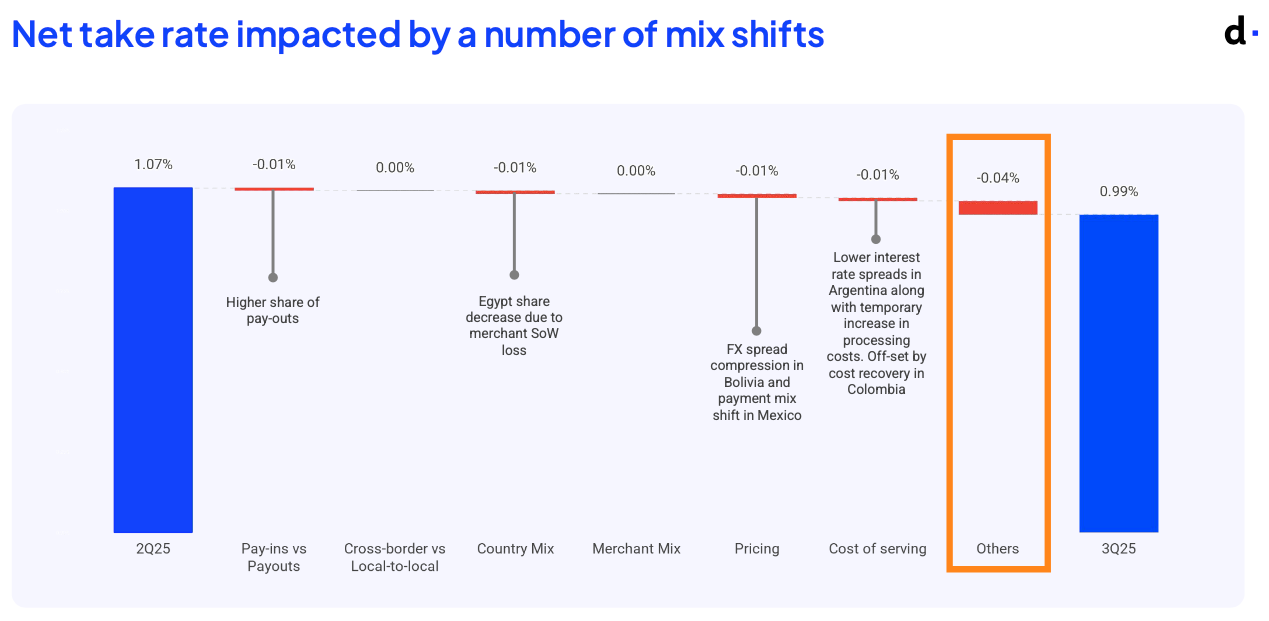
Net Take Rates (Gross Profit/TPV)
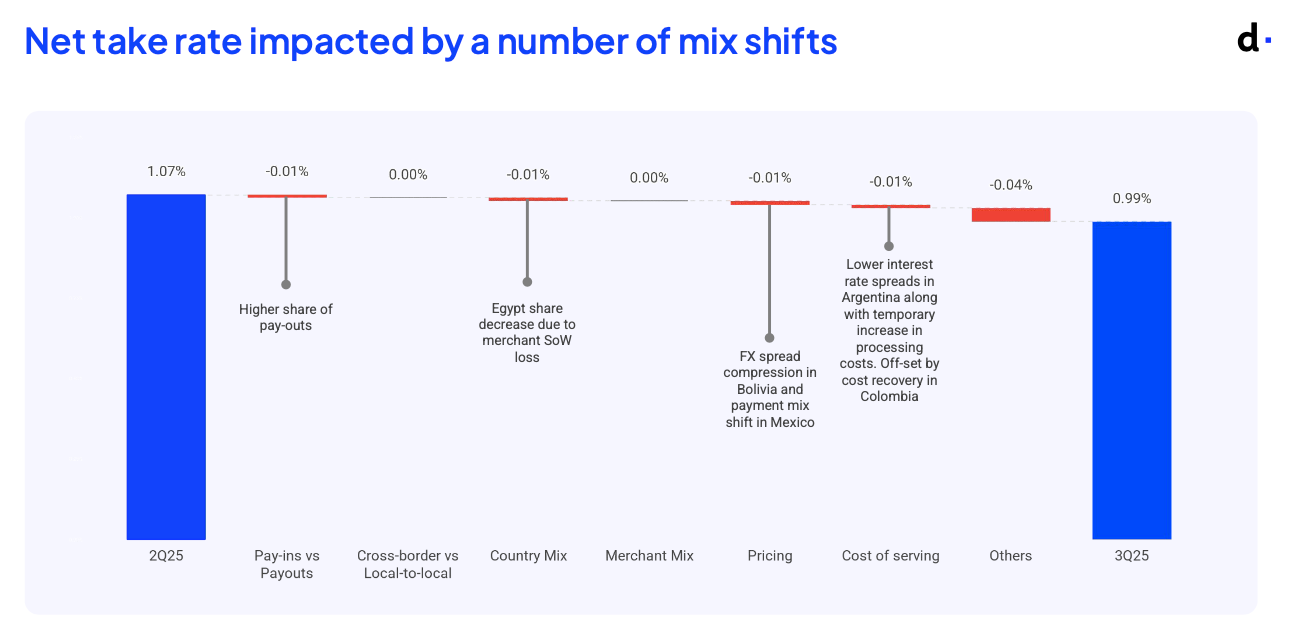
Net take rates are arguably more important as they reflect the true economics, and exactly how much dLocal keeps after paying PSP partners, network fees, payout rails, BNPL revenue share, etc.
Net take rates came down from 1.07% to 0.99% quarter on quarter, and is most likely the reason for the negative stock price reaction after earnings.
Management addressed this in commentary, stating that this was explained mainly by 3 factors:
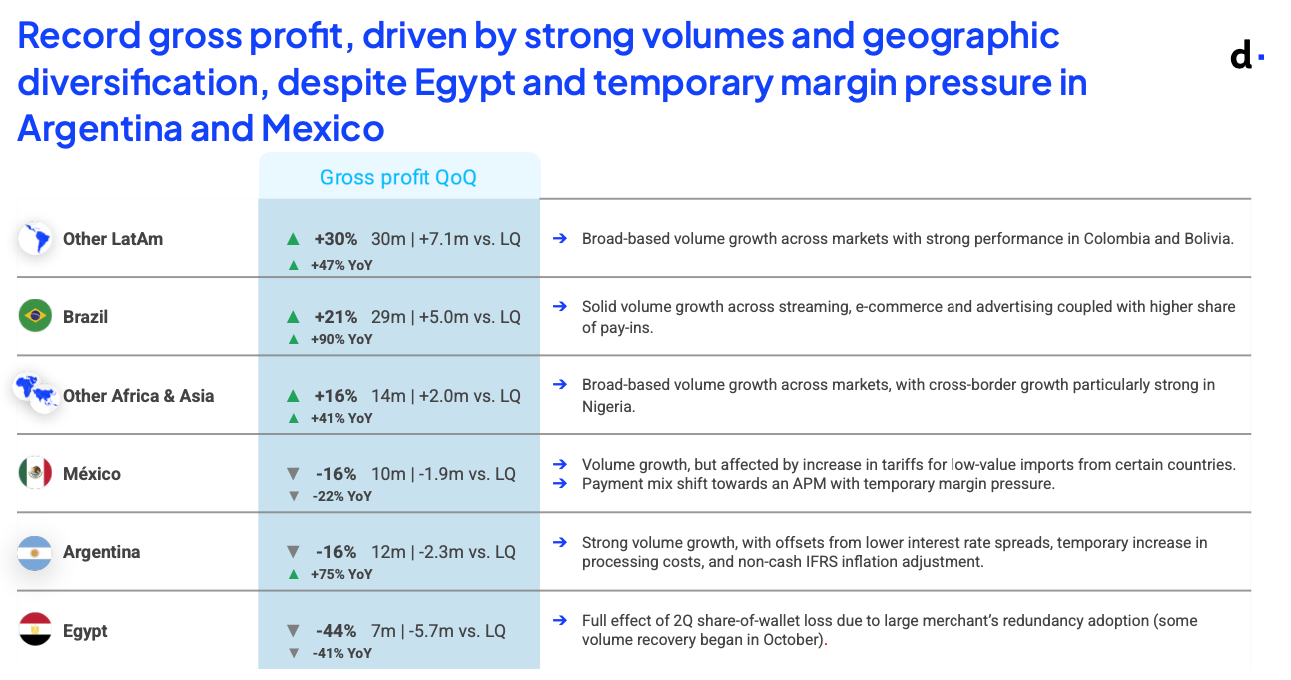
Egypt: A full quarter’s effect of the share of wallet losses that were already referenced in Q2. In Q2, management shared that a large merchant implemented redundancies in the market, this effect was fully felt this Q.
Argentina: lower interest rate spreads and a temporary increase in processing costs.
Payment mix shift towards an APM with temporary margin pressure in Mexico, as well as slowdown in TPV growth driven by tariffs.
Other Metrics
Of course, there are also other important metrics to track.
Adjusted EBITDA to Gross Profit Ratio
A key metric often referenced by Pedro is the Adjusted EBITDA to Gross Profit ratio, that is now at 69.5%. This was a decrease from the previous quarter’s 71%.
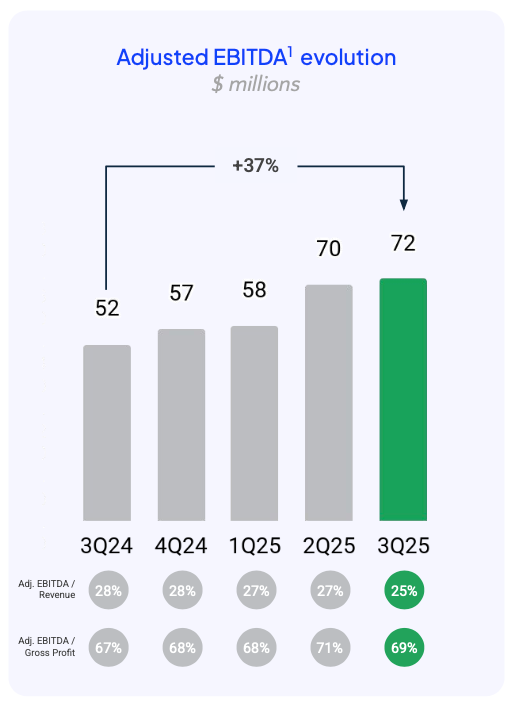
This metric measures operating leverage across the business and an increase would signal increasing op leverage as a result of tech integrations of products and services across the organisation. There will certainly be quarter to quarter fluctuations though.
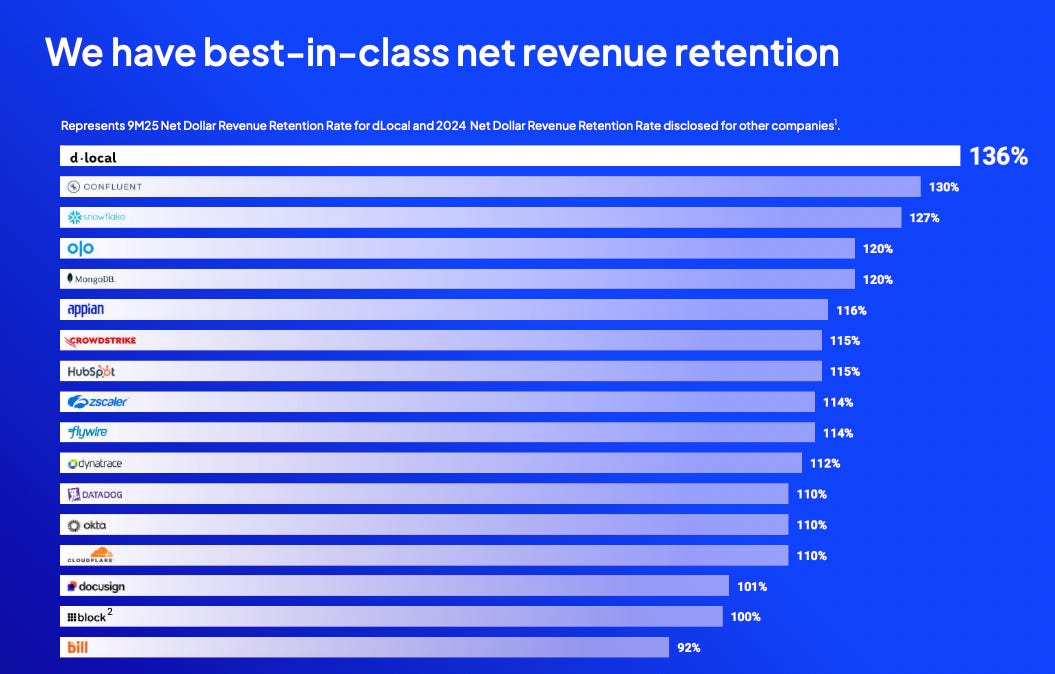
Net Revenue Retention
dLocal has best-in-class net revenue retention rates of 136%.
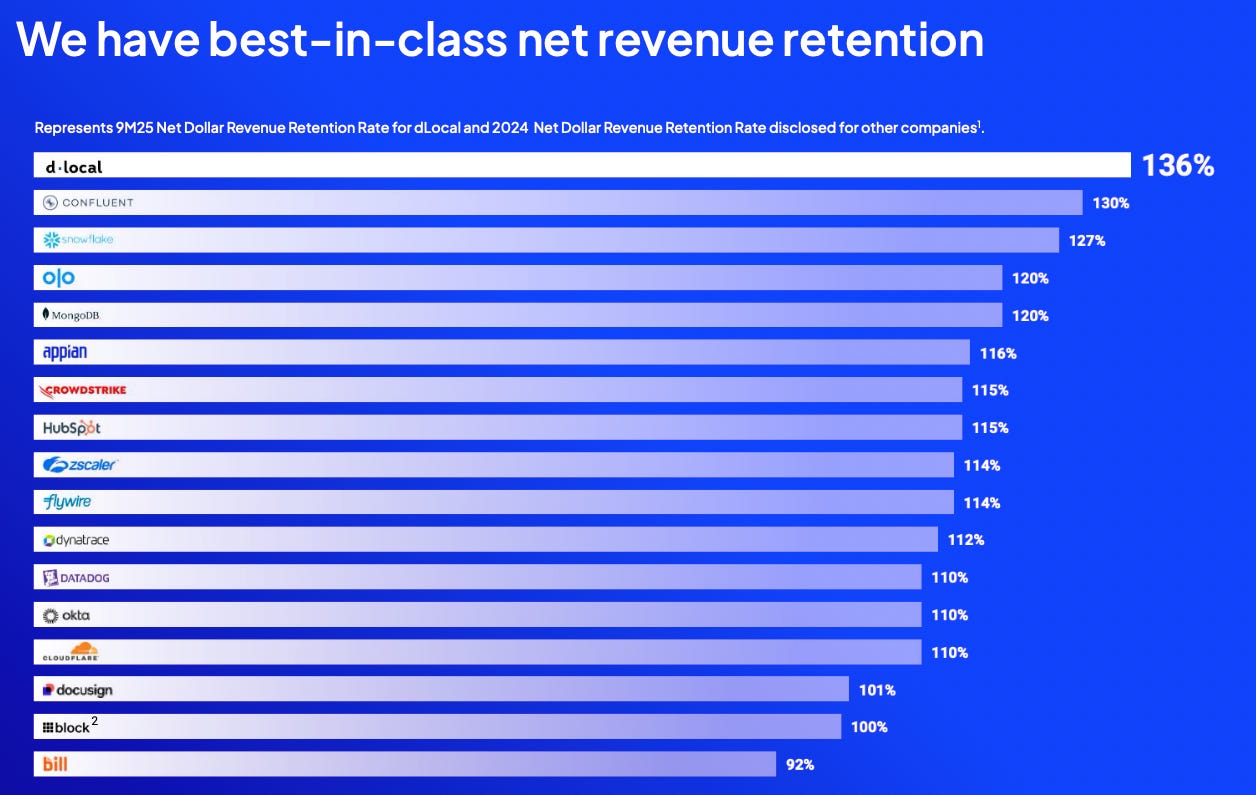
This metric ticked up quarter over quarter to 149%, just an incredible number. This represents a company’s revenue from its existing customers over a period, factoring in upgrades, downgrades, and churn.
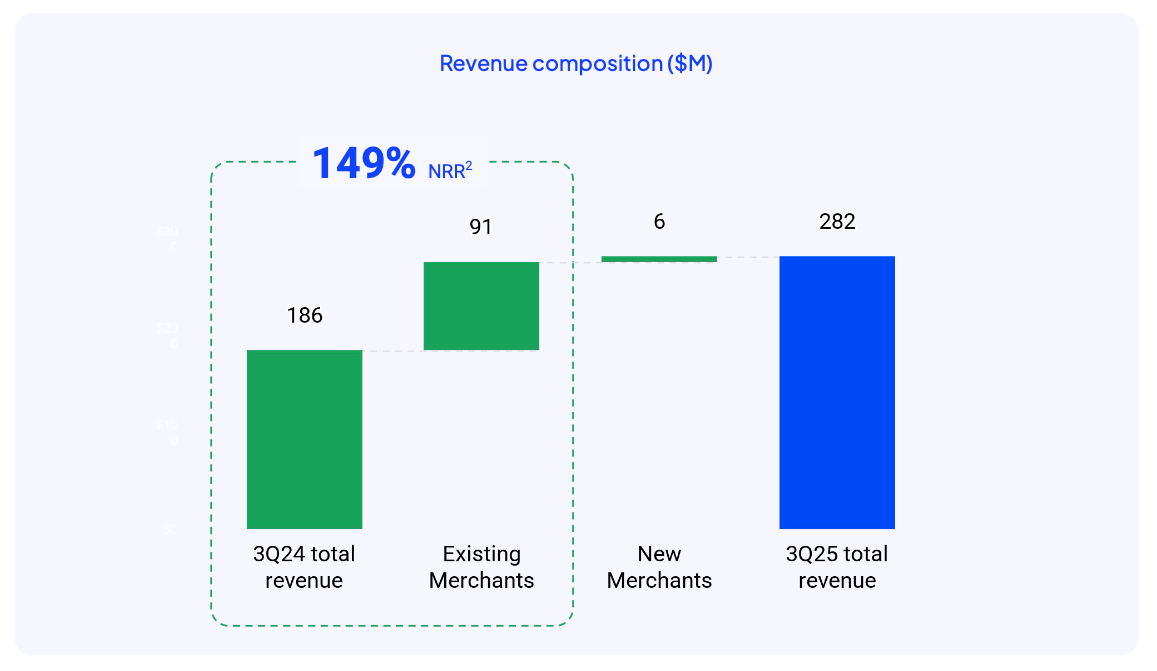
This means that the same customers from last year increased their spend with dLocal by 49%. New merchants added just $6M, reinforcing that the bulk of growth is coming from expansions within existing clients. It may seem concerning that new merchants are adding very little in the way of growth, but this is normal.
New merchants typically take time before contributing to meaningful revenue as payments often see slow activation and ramp up periods, with newer merchants typically starting small before rolling out across 20-30 markets.
Merchant and Geographic Diversification
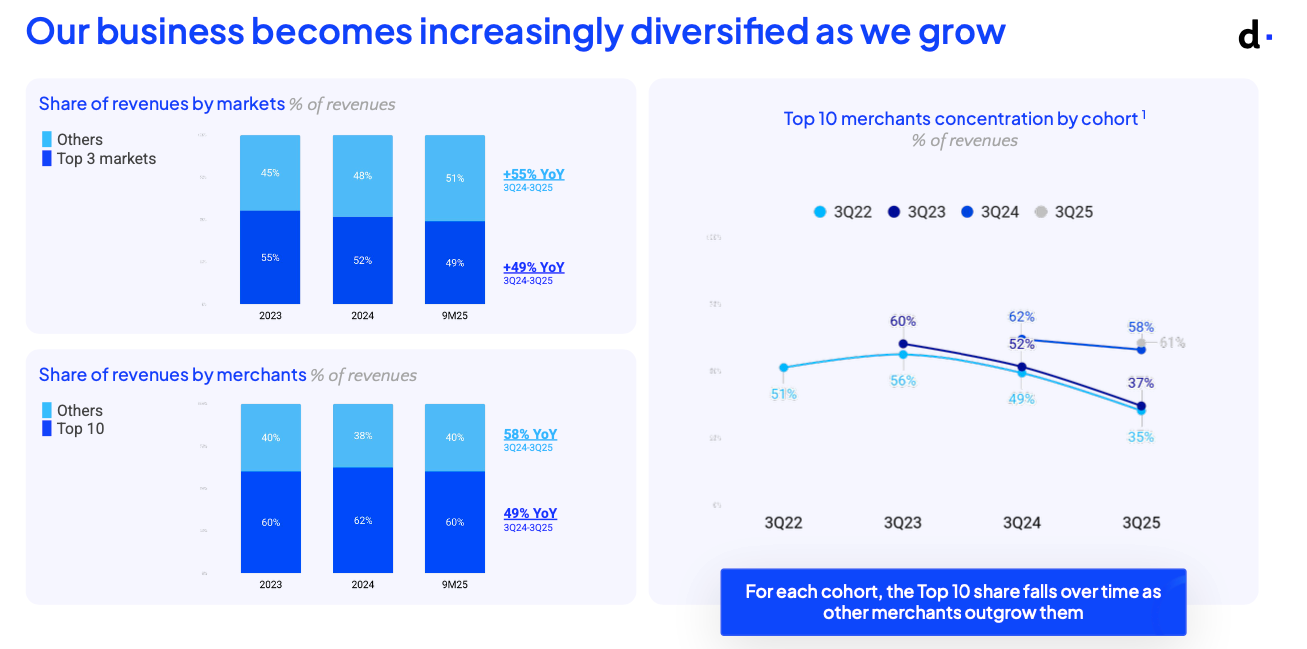
One of the positives this quarter is the continued broadening of dLocal’s revenue base. The share of revenue coming from the top three markets has declined steadily from 55% in 2023 to 49% in 9M25. This reduces regulatory and FX exposure and suggests deeper adoption across the long tail of markets where dLocal operates.
A similar pattern is visible on the merchant side. The top ten merchants accounted for about 60% of revenue in 9M25, in line with prior years but trending slightly lower compared with 2024. However, as discussed during the call, the top 10 merchants are constantly changing, as others outside the top 10 grow quickly to enter the group.
This can be seen in the rightmost chart. The cohort analysis shows that concentration naturally declines over time. The merchants that were in the top ten in 3Q22 have fallen from 51% of revenue to 35% today. The 3Q23 cohort shows the same dynamic, falling from 60% to 37%. Even the most recent 3Q24 cohort has already begun to shrink as other merchants grow faster.
This behaviour is exactly what we want to see in a high NRR enterprise model. As existing merchants expand and new merchants ramp up, the revenue mix becomes less dependent on any single customer, even though the absolute volumes of the largest merchants continue to rise.
3. Guidance
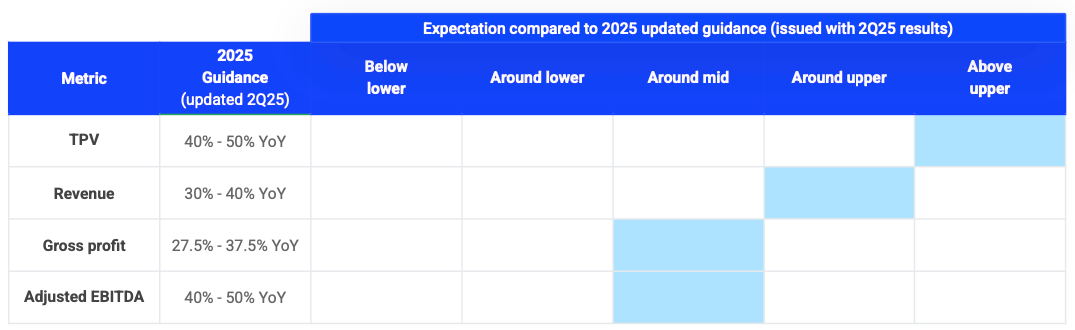
Some clarification re this picture. I’ve seen some confusion online on this as it appears to be a downgrade on the guidance for Gross Profit and Adjusted EBITDA.
Note: This is a guidance expectation relative to the 2025 updated guidance that was issued last quarter.
This means that dLocal is actually guiding for “above upper” range of TPV guidance of its new range for instance. This means raised guidance for TPV and Revenue and maintained guidance for Gross Profit and Adj. EBITDA since the last quarter.
Very good news.
4. Product Development
Last quarter, dLocal shared its deployment of SmartPix in Brazil, launching of BNPL Fuse and partnerships on the stablecoin remittances front.
This quarter, they have given two more updates.
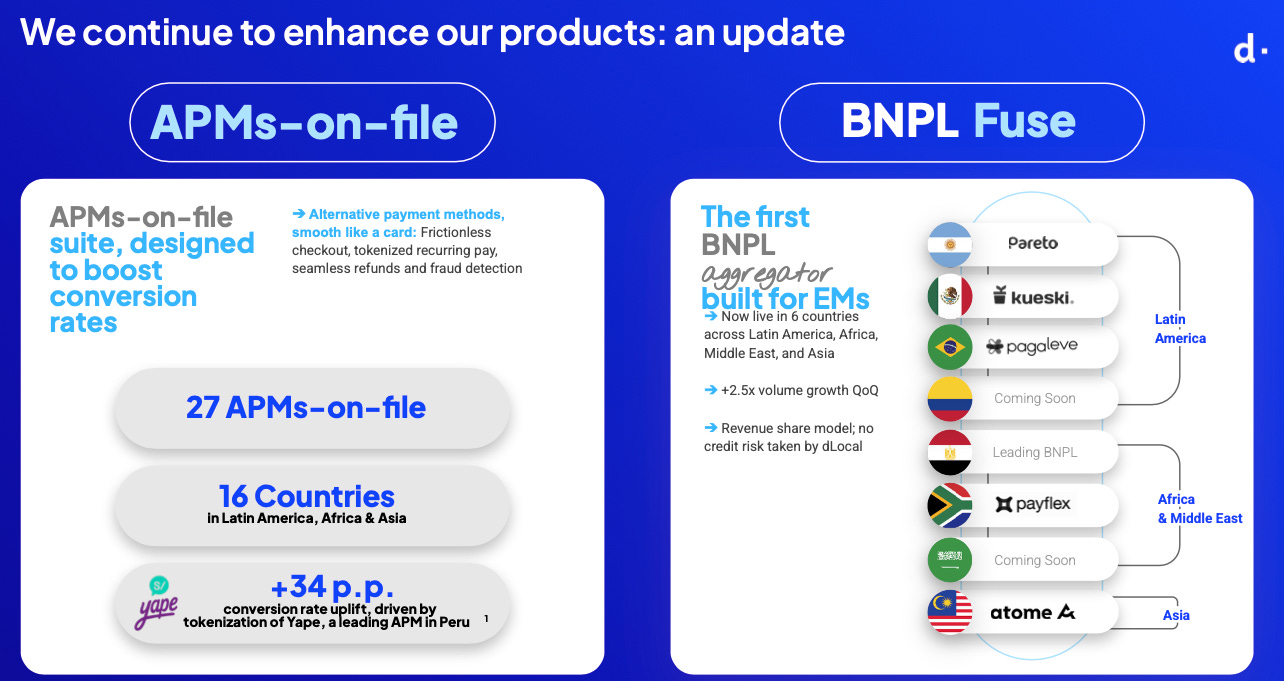
Firstly, their alternative payment methods (APMs) on-file capabilities now cover 27 local payment methods across 16 countries, and is growing quickly. APMs are non-card ways that consumers use to pay in emerging markets (for e.g., PIX in Brazil, cash vouchers, bank transfers, mobile wallets (Mercado Pago)). APMs on-file means dLocal can store these alternative payment credentials similarly to how a merchant would store a card-on-file.
Pedro emphasised the importance of these APMs on-file it enables one-click checkout, higher conversion rates, fewer abandoned carts, repeat purchases without friction etc. An early example of success was Yape from Peru that rolled out tokenisation, leading to conversion rates rising a whopping 34%.
Secondly, BNPL Fuse is dLocal’s new aggregator for buy-now-pay-later solutions. It gives global merchants a single integration point into the fragmented network of local BNPL providers across EMs.
dLocal shared that the product is already live in 6 countries with 2 more coming online shortly. This is a quick rollout as expected, especially given the regulatory and partnership complexity in each market. Although still very early, management highlighted initial signs of PMF, with BNPL Fuse delivering 2.5x QoQ volume growth.
Importantly, the economics are particularly attractive. dLocal deploys BNPL Fuse via a revenue-share model, keeps its asset-light profile, and takes no credit risk. All the underwriting sits with local BNPL partners, while dLocal earns a higher take-rate per transaction.
5. Management Commentary
On Argentina’s impact on take rates:
“I think longer term, the signs coming out of Argentina are positive. And the spread compressions that negatively affected the third quarter and were the principal driver of weak gross profit. A lot of that has been repriced, so as to improve spreads again. And so that’s also positive in terms of potential for Argentina in Q4.”
On sector growth and remittances in particular:
“Almost the entire online consumer digital world is growing at or around that average. And then the one that continues to be soft is advertising. I think looking into 2026, we expect continued strength in remittances in commerce.
Let me remind you that remittances is particularly important because it generates outbound flows into the emerging world, and that makes us somewhat unique in that we are one of the global PSPs, if not the one with the best balance between pay-ins and pay-outs, which generate cross-selling opportunities across merchants, but also allows for interesting netting opportunities, which keep the take rate on our businesses more defensible given those netting opportunities where we keep the entire FX spread.
And we see no signs of alarm for those business. Now obviously, when you’re growing at over 200% like the remittance business year-on-year, you could potentially see natural deceleration but nothing beyond what’s expected when you’re coming from such strong growth.”
On “others” category and its effect long-term on take rates
“There is a strong one-off nature to that other. So that’s not necessarily a continued compression of take rate. I think if you were to call it a normalised take rate, pulling out one-offs, it would have remained above 100 basis points for the quarter. And we’ve always pointed to the fact that I think the general trend for take rate, we believe, is still potentially downward but with a volatile trajectory and not necessarily at a very fast pace. I mean had this been 103%, then it would have only been down 4 basis points sequentially after having gone up a little bit in the second quarter versus the first quarter.”
On alternative payment methods
“They actually have a slightly better margin. They are lower in net take rate because they tend to be cheaper. They also have a significantly lower and cheaper cost basis. I think in many cases, their potential, as you well know, is that their volume increases are significant because a lot of the digitalisation and inclusion of consumers across emerging markets, is not really happening on cards or internationally enabled credit cards, but happening through many of these real time networks or digital wallets. So the play there is a significant volume play. But yes, they do have lower net take rates.”
6. Concluding Thoughts
I thought this was an extremely strong quarter again. Management has really shown their ability to spark growth in TPV, with a 5th straight quarter of acceleration.
The usual concerns remain around take rates and as I discussed in my initial dLocal investment thesis, it is a very real risk. The reason that dLocal has been unable to go on a run despite very strong numbers on the TPV and profitability front, is likely due to concerns over falling take rates.
Personally, I’m not concerned about falling take rates, it is par for the course for any rapidly expanding payments business, much less one that operates in many volatile geographies.
Instead, what i’m focused on are 3 metrics:
TPV
TPV is the true measure of merchant demand for dLocal’s services. Growing TPV means stronger economies of scale, more data, greater lock-in for merchants and more predictable gross profit flows.
NRR
NRR cuts through the noise of take rates and measures whether existing merchants are deepening their engagement with dLocal. A high NRR as we see in this case (149%) is representative of the fact that merchants are processing more payment flows and increasing their reliance on dLocal.
Gross Profit
This is the cleanest financial measure of dLocal’s unit economics and is far less volatile than take rates because it captures real economic spread. This is the number that ultimately drives operating leverage and free cash flow. Unlike take rates, gross profit cannot be distorted by a single large low-priced merchant or an FX swing.


In all, I believe the initial market reaction and an incredible 15% sell off is a huge overreaction. This was a fantastic quarter for dLocal and investors should not be worried. For me, the investment thesis is right on track.
While it might take time for the market to realise what truly matters, I believe patience will be rewarded and dLocal is steadily compounding beneath the surface. It continues to demonstrate the hallmarks of a structurally advantaged payments platform: deep merchant stickiness, accelerating TPV, and strong profitability.
dLocal is, in my view, building a payments franchise that is significantly more valuable than what its current valuation implies. For investors willing to look past quarterly noise and focus on the underlying engine, this quarter reinforced, not weakened, the thesis.
Thanks for reading!